Latino Youth in the Bronx
The Census 2000 shows that Bronx "kids" (up to 17 years of age) have some surprising characteristics. Students may compare youth in The Bronx with others in the rest of the city, and also contrast Hispanic kids with those of other races in The Bronx.
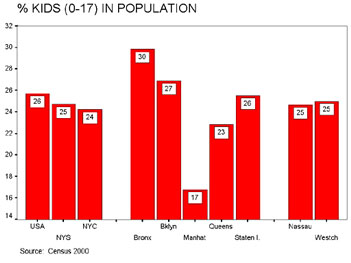
Of all New York State counties, The Bronx has the highest proportion of kids: 29.82% of the total Bronx population. Manhattan has the lowest proportion, 16.78%.
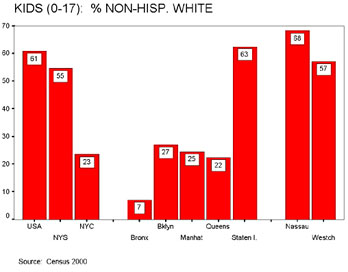
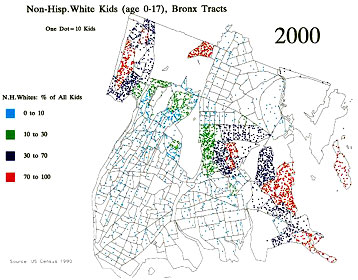
The Bronx's population of Non-Hispanic White kids has continued its drastic decline. By 2000, non-Hispanic White kids were only 2.04% of the total Bronx population. The other four counties comprising New York City had at least double this rate, and no county outside New York City had a proportion of non-Hispanic White kids lower than 14.3%.
If one considers non-Hispanic White kids as a proportion of all kids, the figure for The Bronx is 7.12%. The next lowest New York county, Queens, had a proportion of 22.44%, more than three times as high. In New York State as a whole, 54.65% of the kids are non-Hispanic White.

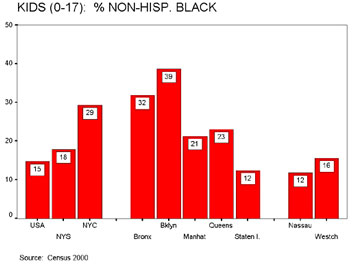
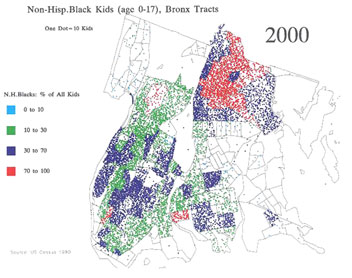
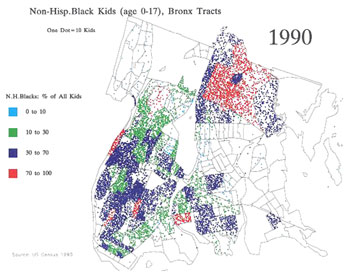
31.86% of Bronx kids are non-Hispanic Black. This figure is second
to Brooklyn (38.61%). In every county outside New York City, Blacks comprise
less than 20% of all kids.
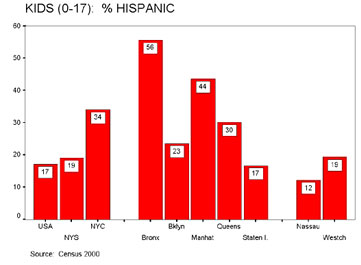
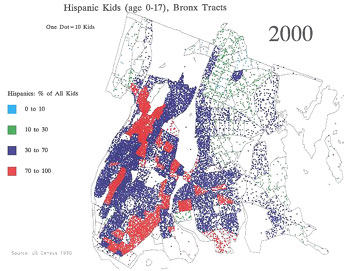
The Bronx is the only county in New York State where the absolute majority of all kids are Hispanic (55.65%. Manhattan is next, with 43.58%). In no county outside New York City is the figure as high as 20%.
In The Bronx, and in Manhattan, an absolute majority of Hispanic kids identify themselves as "other race" rather than the traditional categories of Black, White, Asian, Pacific, or American Indian. Only in Manhatttan and The Bronx do less than 30% identify themselves as being of the "White race." In all counties outside New York City except Monroe (Rochester), a plurality of Hispanic kids call themselves "White."
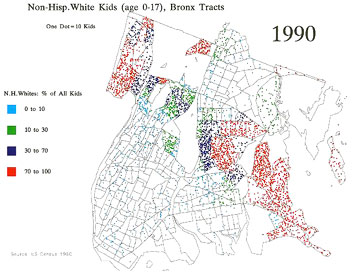
There is no good reason to suppose that the hemmorhage of White kids from The Bronx will be stopped. Increases in Hispanic kids are in large measure the result of recent immigration, and thus pose extraordinary challenges to the school system and other social services.
Maps can show in detail what has happened to kids of the three main ethnic categories over the past decade. The dot-density maps, keeping dot size and color constant allow us to see how sparse non-Hispanic White kids are, even in the areas where they are predominant. For Black kids, we note a further concentration in the north (middle class) Bronx, and a decline in the Morrisania ("underclass") area. For Hispanic kids, the growing red area in the West Bronx is adjacent to the Dominican stronghold in northern Manhattan. The combined area is large enough to be considered an entire "Hispanic world." Of course, many kids in such an area will eventually become assimilated into the "American mainstream." But an even larger group of new immigrants may continue to flow in, creating ongoing social and cultural challenges.
The bar graphs above show the proportions kids represent of the total population. First is shown all kids in the various boroughs of New York City, NY State and the country as a whole. The other three graphs indicate the percentages White, Black and Hispanic kids comprise compared to kids of the same race in other boroughs of the City, the State and the US.
