Geographical Distribution By Race
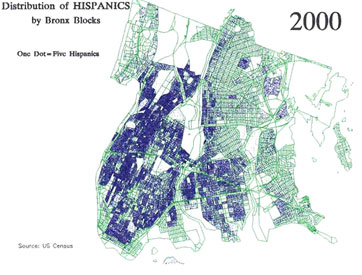
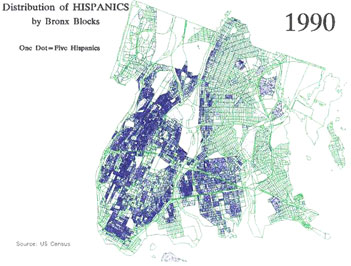
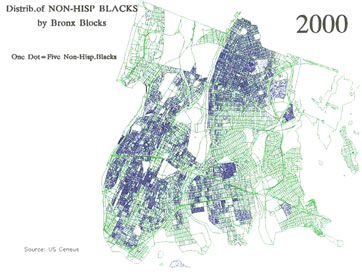
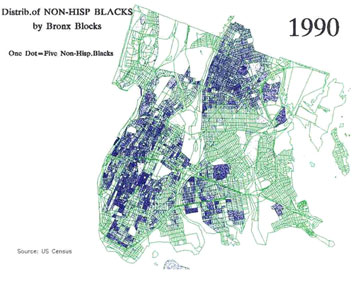
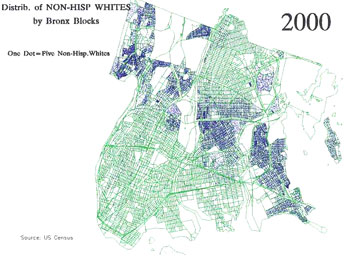
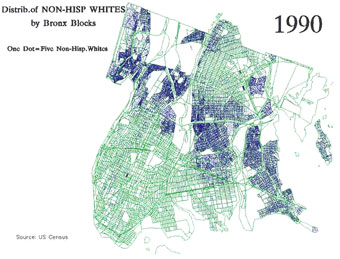
Dot-density maps with the same scale and colors allow us to compare the distribution of Hispanics, non-Hispanic Blacks, and non-Hispanic Whites in 2000 and in 1990. Notice how the location of each group on the map remains fairly constant while the density changes (increasing for Hispanics and Blacks, and decreasing for Whites).
